16 October 2026
About 12-million people voted for their municipal leaders on 1 November 2021, roughly 46% of registered voters. That was the lowest turnout in a local election since democracy.
In most metro municipalities, an even smaller proportion of registered voters turned out in 2021.
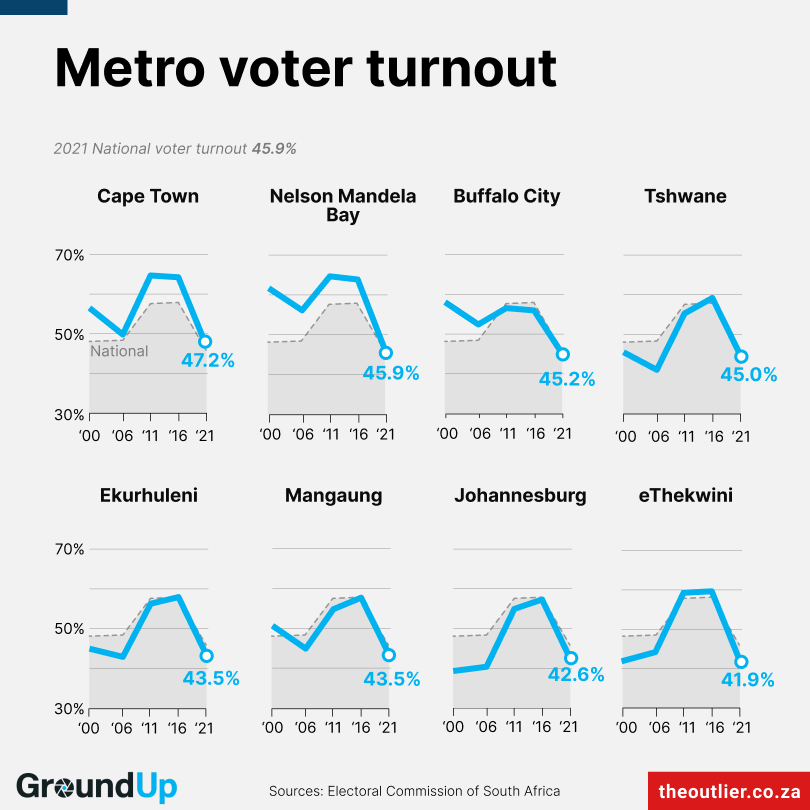
Cape Town had the highest metro turnout, at about 47%, slightly above the national average. Nelson Mandela Bay matched the national figure of about 46%. eThekwini was lowest at about 42%, followed by Johannesburg (about 43%), Ekurhuleni and Mangaung (both about 44%), Tshwane (45%) and Buffalo City (46%).
All metro municipalities saw a significant drop in turnout from the previous two local government elections. In Cape Town, for example, voter turnout was about 64% in 2011 and 2016.
One survey of metro voters found that it was practical obstacles, rather than a rejection of voting, that stopped people from turning out. A different study of national voters found the opposite: political disillusionment was the main reason that people stayed away. 
Ten years before voter turnout dropped in 2021, the opposite happened. Turnout in the 2011 local government election was nearly 58% nationally, a big jump from about 48% in 2000 and 2006.
Turnout in many metros was very low in 2006, but rose sharply in 2011. Researchers have suggested various reasons for this, including lively campaigning by opposition parties and increased service delivery protests in metros: people who participated in these protests may have been more likely to vote to get government’s attention.
With elections on 4 November, it is unclear whether metro turnout will recover. South Africa’s biggest pre-election poll, by News24 and SABI, assumed a 52% turnout in its modelling.
The second-biggest poll, by Ipsos, surveyed 3,600 people across the country in June and July. Of those who were registered to vote, about three-quarters said they were likely to vote.
Ten weeks before the 2021 election, 71% of registered voters surveyed told Ipsos they intended to vote. But a week before the election, Ipsos’s most likely scenario was that 56% of registered voters would vote. In the end, 46% did.
External factors, such as weather on the day matter too.
Chart produced by The Outlier in partnership with GroundUp.