9 November 2026
The results of the 2026 local government elections were finally announced on Sunday night. The Outlier and GroundUp took a close look. Here’s our takeaway.
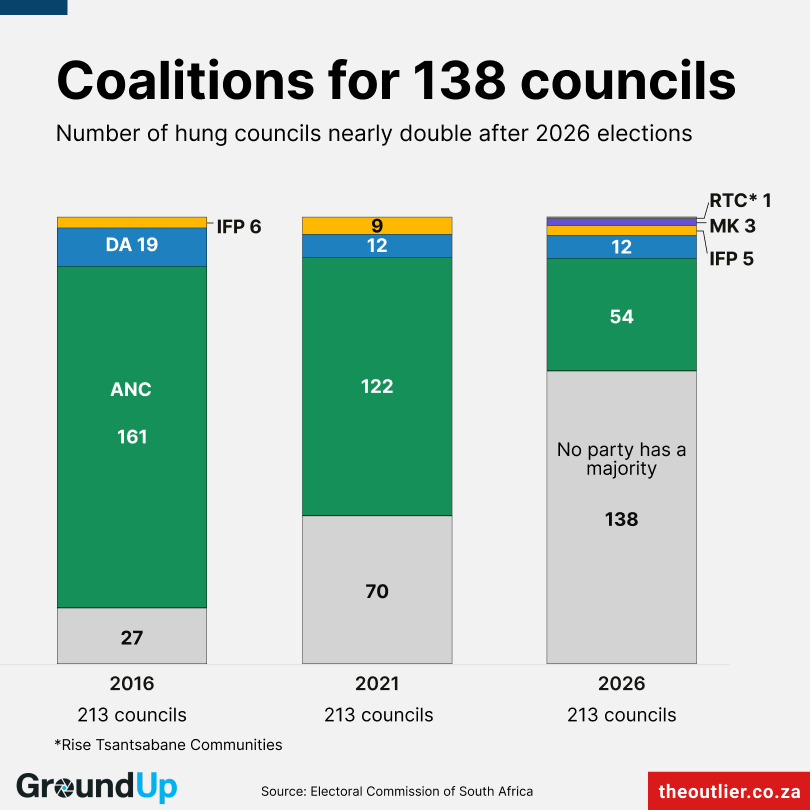
The biggest takeaway is the decline of the ANC. After the 2021 election, the ANC had control of 122 of the 213 municipal councils. After this election, it will now control only 54.
A whopping 138 councils will be run by coalitions, almost double the number in 2021. About 63 councils previously run by the ANC, one previously run by the DA and six run by the IFP are now hung. This is because of gains by new parties, such as the MK party in KwaZulu-Natal, and smaller parties like the Patriotic Alliance in the Western Cape.
Councils must hold their first sitting, where they elect a speaker and mayor, within 14 days.
The ANC lost council seats in all eight of the country’s metros. The DA gained seats in all of them except Buffalo City, eThekwini and Tshwane.
Jacob Zuma’s MK party contested its first local government election and pushed the ANC out of power in eThekwini. MK now holds 86 of the 223 council seats, the DA 57, the ANC 37 and the IFP 15.
ActionSA also gained seats in all the metros. It does not control any of them, but it could be a kingmaker in several coalitions. The EFF lost ground in all the metros.
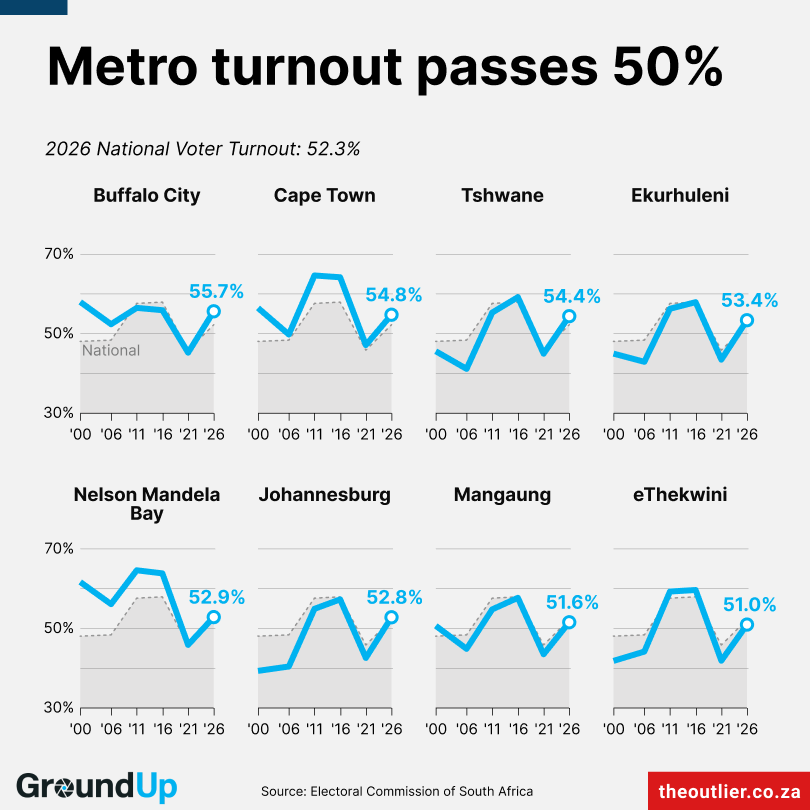
About 14.9-million people voted on Wednesday. That’s 52% of the 28.5 million people on the voters’ roll, up from 46% in 2021.
The 2021 turnout was the lowest of any local election since at least 2000. This year’s turnout is the highest since 2016.
About 34% of all adults in South Africa voted, up from about 30% in 2021. (We used the Thembisa model’s population estimates for this calculation.)
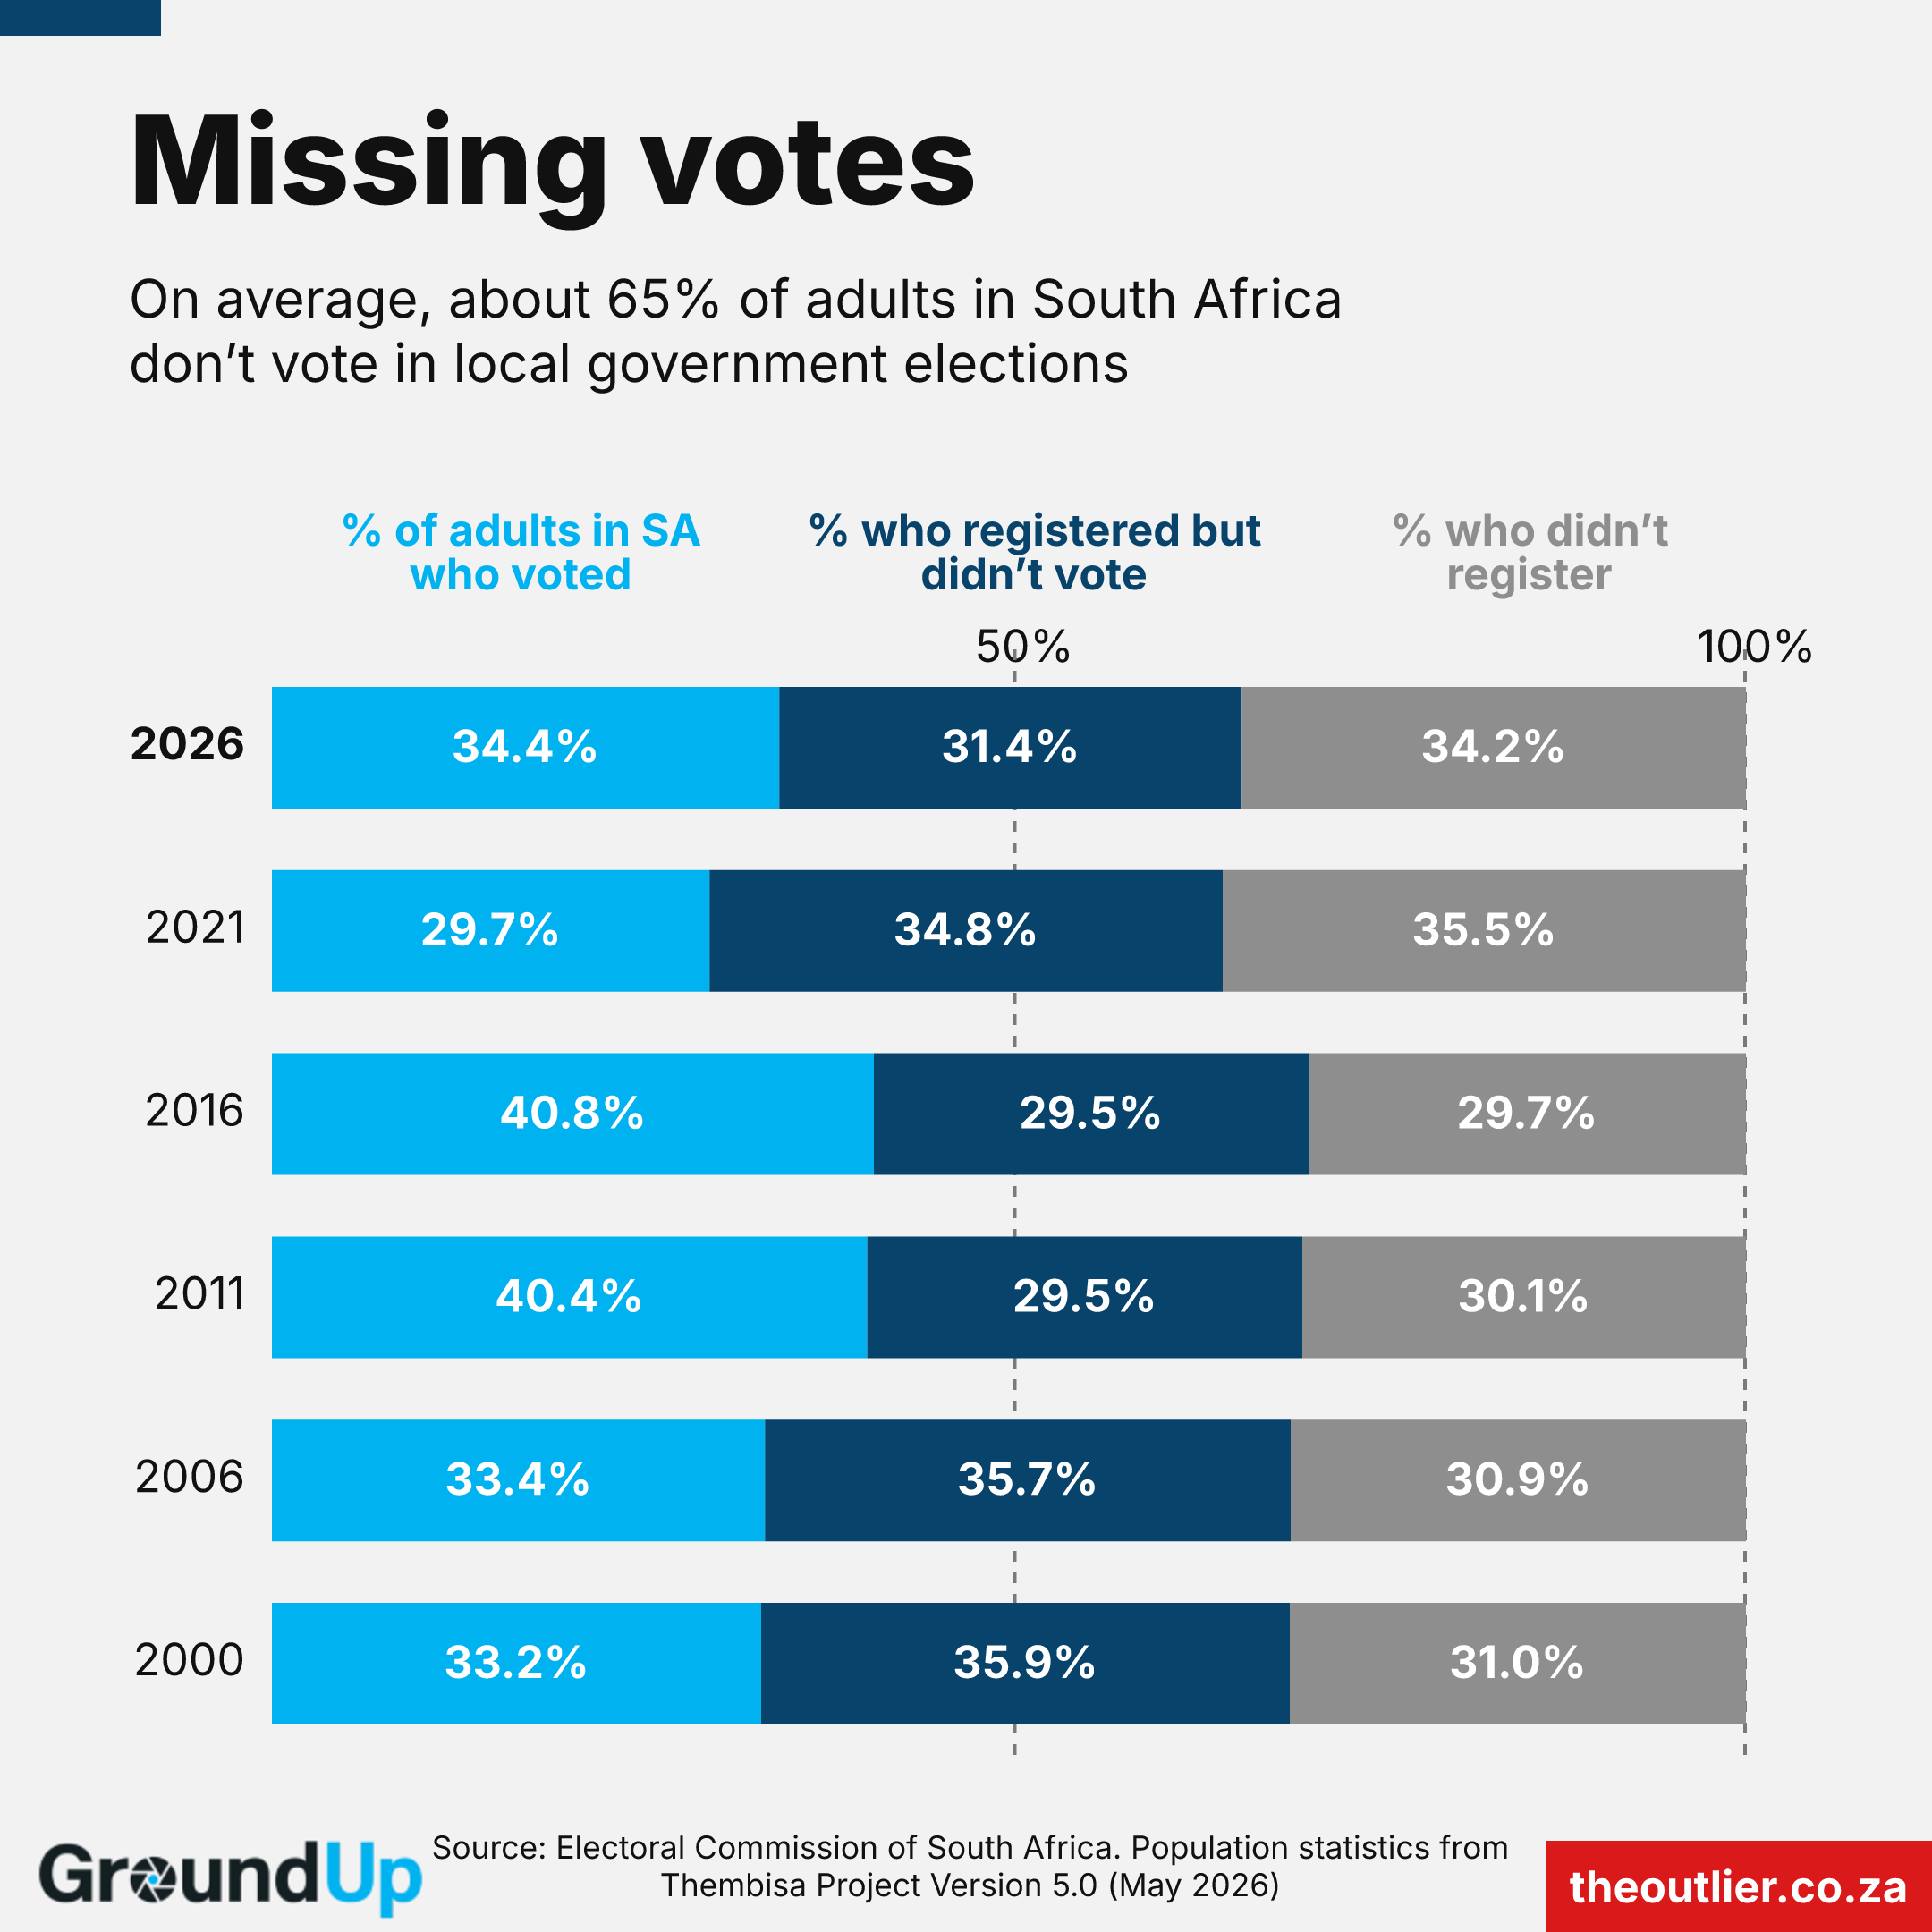
The voters’ roll barely kept pace with the adult population, though. About 66% of adults in South Africa were registered this year, slightly more than in 2021.
Explore the results in your ward and municipality on the Outlier’s interactive dashboard.
Charts produced by The Outlier in partnership with GroundUp.