Facts and myths about Cape Town’s water crisis
As Day Zero approaches, nonsense is being spread
Cape Town Mayor Patricia De Lille has announced that Day Zero is now more likely than not. From 1 February, all households have to reduce their municipal water consumption to 50 litres per person per day. The World Wide Fund for Nature has published useful guidelines for preparing for Day Zero.
As Day Zero approaches, there are more signs of panic and anger by the city’s residents. It’s understandable, and if the anger can be directed towards resolving the crisis, that’s great. But there are also myths being circulated that need to be debunked.
Myth: Migration from the Eastern Cape is the cause
Recently the technology website Slashdot reported a BBC story that Cape Town is running out of water. One of the most upvoted comments in response blames the drought on migration of “peasants” (the word used) from the Eastern Cape.
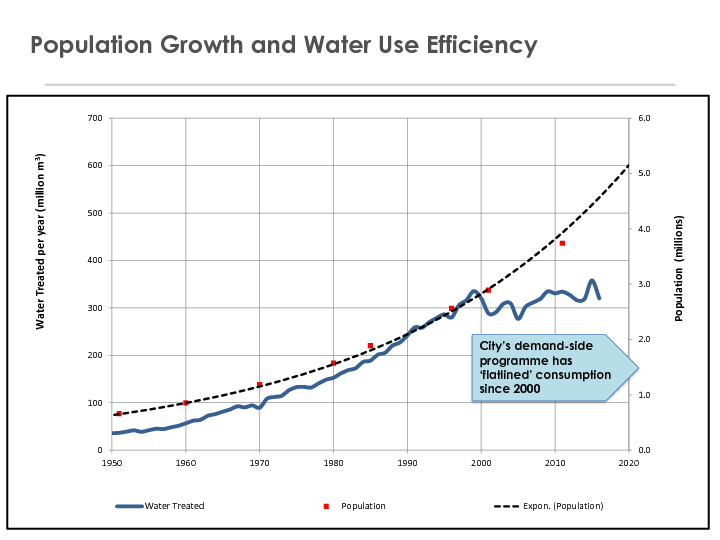
The less prejudiced expression of this myth is that population growth is to blame for the water shortage. In a limited sense this is true. If Cape Town had one million instead of four million people, there’d be no problem. But population growth alone doesn’t explain the water shortage. As the graph below from the City of Cape Town shows, water consumption has stabilised since 2000. In the last year, with increased restrictions and awareness, consumption has dropped considerably.
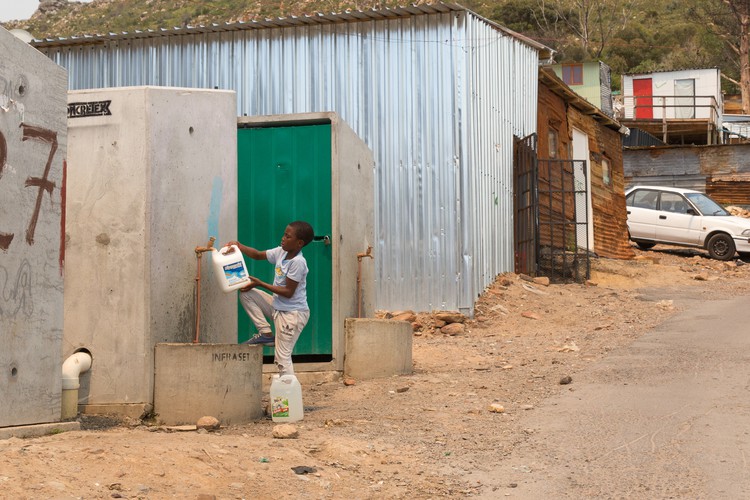
Moreover, people from the Eastern Cape primarily move to the city’s informal settlements. In informal settlements, households generally have to get their water from communal taps; usage is much lower on average than formal households. Long showers, full baths, maintaining gardens and keeping swimming pools filled are not a common feature of informal settlement living.
Professor Neil Armitage, Head of UCT’s Urban Water Management Department estimates that less than 5% of the city’s metered water is consumed by informal settlements. Formal houses are responsible for 66%. (These numbers may have changed since the article quoting him was written a few months ago as consumption has come down.)
Incidentally, a good deal of the Eastern Cape, including Port Elizabeth, is short of water and enduring water restrictions.
Myth: Farmers are to blame
An article published on the Daily Vox contains a video taken by two Cape Town “vloggers”. The video is sensationalist nonsense and the article uncritical of it. The video shows water from Theewaterskloof being released to farms. The “vloggers” then throw about misleading statistics about how much water it takes to make a cow, a bar of chocolate, a cup of coffee and other edibles. Presumably you’re supposed to be so outraged that you immediately march to Patricia de Lille’s office and demand that she puts an end to all farming in the Western Cape. It’s ridiculous.
Agriculture is critical to the Western Cape economy, and the loss of crops, even farms, may be one of the consequences for the city if the dams run dry. Shirley Davids, spokesperson for farm workers’ union CSAAWU, warns of the loss of livelihoods to farm workers, who will probably be dismissed if farms don’t get enough water.
Jeanne Boshoff of Agri Western Cape sent GroundUp a detailed rebuttal of the video. We’ve included it in full below. But in a nutshell, farms have cut back on their water consumption and they are struggling.
Boshoff writes: “Hundreds of hectares of citrus trees have been cut back and hundreds of hectares of orchards have been pulled out in an effort to save the little water allocated to producers. [This] means smaller yields [and] less food. Indications currently are that the deciduous fruit harvest will be 20% smaller. This means [fewer] seasonal workers will be employed, and for a shorter period of time: an estimated 50,000 seasonal workers will have below normal income or no income at all.”
She also points out: “Grazing and feed shortages resulted in massive culling, causing local red meat supply to tighten, and meat price increases as a result of the drought-induced supply shortages.”
Fact: This is the worst drought in recorded Cape Town history
The main reason for the water shortage is, quite simply, a lack of rain in the water catchment area, probably a consequence of climate change. A lot has already been written on this so no need to repeat it here. Here are articles by UCT scientists that explain the drought:
Complicated: The municipality is ultimately responsible for sorting out the water crisis
Though the municipality is ultimately responsible for sorting out the water crisis, provincial and national government are also on the hook. The Constitution gives municipalities exclusive power over “potable water supply systems and domestic waste-water and sewage disposal systems”, but higher tiers of government must monitor and support development of local government capacity. And, what is more, they must “see to the effective performance” of municipalities’ water functions.
The Constitution says everyone has the right to access sufficient water. So all spheres of government have a role to play, and constitutional duties in realising the right to water.
The Water Act of 1998 states that the national government is the “public trustee” of the nation’s water resources and must ensure that water is “protected, used, developed, conserved, managed and controlled in a sustainable and equitable manner, for the benefit of all persons”. It says: “The National Government, acting through the Minister, has the power to regulate the use, flow and control of all water in the Republic.”
The day-to-day management of the city’s water is the job of the municipality (including cleaning and reticulation), but national government is responsible for oversight and bulk water supply. Hence, local, provincial and national government are all accountable.
These articles deal with the national government’s response:
Myth: It’s just a matter of catching the water off Table Mountain
There are no easy solutions to the water crisis. Many measures are needed. Catching the water off Table Mountain is not a trivial measure. The municipality is taking several measures, which are described in What is government doing about Cape Town’s water crisis? Of course more should be done to use untapped water sources, including catching more water from the mountain before it runs into the storm water system or the sea, but that is not a quick-fix solution.
Fact: The municipality is having a very ill-timed internal fight
The current battle between Mayor Patricia de Lille and others in her party is ill-timed. Cape Town is facing one of its worst environmental crises. Leadership is needed that people can trust. That means that when City politicians and officials provide information on the water crisis we need to be confident that it isn’t spin. And when the mayor proposes a drought levy, we need to know that her party supports it. Divisions and playing politics with water will be disastrous for Capetonians. The City should put a recognised and respected water expert in charge of all communications on the drought.
Do you have questions about the drought? Email them to [email protected] and we’ll try to find the answers.
The section on the role of national and local government was updated on 24 January 2017 based on a useful comment received from reader Simon Liell-Cock.
Response to video on Daily Vox by Jeanne Boshoff of Agri Western Cape
Re the video:
A farmer doesn’t use x amount of water to put food on your table. The entire value chain does.
I am not sure why they included coffee and chocolate as examples in the video, because South Africa neither produces coffee nor cocoa beans.
The remark that “vegans make sense”, makes no sense at all since fruit and vegetable production also require water and since both of these industries (in the Western Cape) have been extremely hard hit by the drought and water restrictions. Example: In the Ceres area, the limited water supply resulted in 50% less onions and 80% less potatoes being planted this season. The impact of this (besides less food being produced), is wage losses of millions of rands for seasonal workers. It may also potentially influence the consumer in price increases. Due to water shortages, two tomato canning factories in Saldanha Bay ceased operations, resulting in thousands of potential job losses. The factory in Lutzville that produces tomato puree has closed for the season, also impacting on employment. The value chain needs raw product from farmers and if it can’t be provided, in this case because of a water crisis, the negative domino effect is massive on the total community.
4. Hundreds of hectares of citrus trees have been cut back and hundreds of hectares of orchards have been pulled out in an effort to save the little water allocated to producers. Fewer producing hectares means smaller yields, less food. Indications currently are that the deciduous fruit harvest will be 20% smaller. This means fewer seasonal workers will be employed, and for a shorter period of time: an estimated 50,000 seasonal workers will have below normal income or no income at all. Agriculture is the backbone of our province’s rural economies and the effect of the drought can lead to devastating socioeconomic and economic effects. The fruit industry is also the largest contributor, by value, to South African agricultural exports. The industry has a high job-multiplier effect and creates thousands of jobs in the value chain. The industry is also an important generator of very valuable foreign currency inflows, which is now also under pressure.
5. Grain yields in the winter producing regions have been far below average, in some areas 50% below average. In some areas north of Moorreesburg, producers had no yield at all.
6. The red meat producers in the province are totally reliant on drought relief and we thank every member of the public, every institution and every company for continuing to contribute to Agri Western Cape’s drought relief fund, for understanding the important role of farmers in the country and for supporting our producers who supply food and fibre amidst the worst drought in over a decade. Grazing and feed shortages resulted in massive culling, causing local red meat supply to tighten, and meat price increases as a result of the drought-induced supply shortages.
7. South Africa is ranked first on the Dupont Food Security Index’s list of food security countries in Africa. Internationally. We were placed 44th last year, a phenomenal achievement and an improvement of three places despite the drought and despite producers’ water supply being curtailed by between 60% and 87%, and even 100% in some areas. The only people who can get credit for this are our farmers and our farm workers.
Support independent journalism
Donate using Payfast
![]()
Don't miss out on the latest news
We respect your privacy, and promise we won't spam you.
Next: Dis-Chem accused of victimising union members
Previous: Cape Town teacher accused of sexual assault appears in court
Letters
Dear Editor
One of the greatest dangers of water shortage is lack of hygiene and resultant epidemics I need not name. Why can't sea water be pumped into the municipal system for purposes other than consumption?
Toilets could then be flushed, people bathed and laundry washed, and swimming pools filled. Tanks with desalinated water could be put up for cooking and drinking, or bottled water supplied.
Dear Editor
Yes, indeed, the vlog was misleading. But still there is too little in depth, real journalism on the warnings issued about the effects of climate change on the Western Cape decades ago, and the showboating of the DA and the ANC, at the expense of national interests.
The point is that our leaders, bereft of long term vision, have fully screwed us due to their incompetence. Had these warnings been taken seriously, we would not be facing the social armageddon we face now. My anger is at the politicians. They have failed us. Spectactularly.
Dear Editor
To answer Mary Sadler's question on why we can't allow sea water into the municipal system: Salt water is highly corrosive to metal. Allowing sea water into our municipal system would result in a massive decay of infrastructure.
Dear Editor
Even after we get through this drought, we've been told by the City of Cape Town that reduced water consumption is the "New Normal" and that the weather patterns for the Cape may have permanently changed.
It sounds as if we can no longer predict seasonal rainfall with accuracy, and it is likely that we'll be getting less rain overall in future. If that is the case, then why is desalination not the number-one priority? Unlike rainfall, a desalination plant's ability to produce clean water is not up to nature - it's entirely artificial, and can be repaired and maintained on a more reliable schedule.
I would sooner pay a little more for my water, if there was a guaranteed "base load" available - with the rainfall and dams acting as a secondary source. The price of water might fluctuate more dramatically between seasons, but at least we wouldn't be risking another total shutdown like this.
Dear Editor
I agree that it is a little late to build a water supply right now but the rainy season is close, so they need to prepare to save that water. If they were to look at the technology produced to save water in California, many thousands of gallons could be saved.
The first cause of water loss that I heard of was evaporation. Why not fight this with the plastic balls that California fills their reservoirs with? This could impact some other uses of the reservoir, but water is more crucial and essential to all life. This is just one of many tools developed to fight this problem.
The tools are out there. Look to the people that have been dealing with this problem for years. I keep seeing reports on the problem but very little long term solutions. Have a meeting with the men and women in California that fight this problem every day and you will definitely see progress.
Dear Editor
Cape Town’s population increase from 2000 is approximately 1.5 million, but we are told that water consumption (the graph refers to water treated), fell and then flatlined since 2000. Even if demand reduction and leakage management was in place, this graph makes no sense and requires further investigation:
1. Annual quantity of dam water supplied from dams to CoCT
2. Annual quantity of potable water invoiced to consumers by CoCT
3. Annual dam water quotas allocated to agriculture and other towns
These stats would certainly be interesting to have and would possibly reveal what went wrong.
Population growth is accompanied by business growth (probably around 60% over the period) and tourism growth. But we are told that water treated by CoCT flatlined from 2000? Common sense says this cannot be right.
Dear Editor
In the midst of what is probably the most serious crisis the City of Cape Town has ever faced, the DA is engaged in a vicious internecine battle with its Mayor.
While there may indeed be cogent reasons for trying to dislodge de Lille, surely more mature leadership (at all levels) could have had the common sense either to begin their bloodletting much earlier, or later.
That the senior leadership has failed miserably in their timing will only exacerbate the water crisis, and will cost them future votes.
Dear Editor
Peninsula rainfall figures are irrelevant in assessing the duration and severity of this drought. The article claiming a “once in a thousand year event” (http://www.csag.uct.ac.za/2017/08/28/how-severe-is-this-drought-really/) , used rainfall figures from Peninsula stations and also estimated rainfall for 2017 at 37% of normal, whereas the final figure was 52%. The author cautions in his footnote, against relying the 1000-year claim, mentioning an interval period of 80 years.
Rainfall in dam catchment areas is relevant. Steenbras Dam figures (from CoCT report titled “Business Briefing On Water Crisis” 9 May 2017), show 10 consecutive years of below average rainfall from 1926 to 1936, of which 5 were drought years (less than 75% of average). Why claim that we have never had 3 consecutive years of low rainfall?
Refer to the SAEON report :
http://www.saeon.ac.za/enewsletter/archives/2017/october2017/doc01)
Conclusion :
"If the long-term rainfall records we examined are representative of general trends in our catchments, statements like "worst drought in history" or "worst drought in a century" appear to be unsubstantiated. The 1920s-30s drought (to name one) was dryer and lasted longer than the current drought (to date).
If Cape Town has experienced previous droughts of similar magnitude, the reasons why this particular drought is having such a dire impact seem to be first and foremost related to water demand, not rainfall."
Refer to the DWA rainfall figures for Theewaterskloof and Jonkershoek (Berg River dam), for the last 3 rain years ending October. Although rainfall is low, neither station has experienced 3 consecutive years of drought ( SA Weather Service definition). For Theewaterskloof, similar low rainfall periods are quite noticeable in the late 70’s and in early 80’s.
Although long term rainfall data in dam catchment areas is scarce, what we have points clearly to this drought being no worse than previous periods of low rainfall. Claims of worst in 100 years, a thousand years or the worst on record, are simply not supported by FACTS
GroundUp Editor's Response
Dear Peter
This morning we published this article by UCT water scientist Piotr Wolski:
https://www.groundup.org.za/article/how-severe-drought-detailed-look-data/
It shows that the drought over the water catchment area is the worst on record.
Dear Editor
The statement that about 60% of inhabitants of Cape Town are ignoring or not adhering to the present water restrictions are quoted in many publications as well as by the City itself. That is presumably to help justify the restriction measures and the tone of the water campaigns. Unfortunately, that figure is not a reality, but an estimation, using the assumption that there are on average 4 inhabitants in every dwelling for which the City has a meter reading. The City has no idea whether those dwellings using more than 10 500 litres for the month actually have more than 4 people living there permanently or even sporadically (e.g. visitors). The associated blaming has resulted in an unfortunate loss of good will amongst many those who pay for water (the only water users that the City has usage data for per dwelling). I suspect that if a proper representative survey could be carried out, this figure of 60% non-compliance may look very different.
Dear Editor
About the video and the comment that "vegans make sense". I don't agree that it's accurate and I feel the numbers thrown around in that video were poorly presented. Some context would have gone a long way as well as differentiating between people living vegan (ethical) and people who merely eat a plant diet.
There's a good reason so many organisations (including the UN) have for more than ten years now been encouraging a global shift towards plant-based eating - or, more specifically, away from animal-based eating. Animal agriculture is widely recognised as the single-most environmentally destructive industry on Earth (especially when accounting for the myriad peripheral industries that exist because of it).
Consuming animal products is a spectacularly inefficient way to feed humanity. When compared to feeding people the proportionate amount of nutrition/energy using plants we see that animal ag is frighteningly resource-intensive and highly wasteful. This includes water-usage, of course.
Naturally the exact numbers around how much water is needed in different value chains in various parts of the world for different products will differ. What doesn't change is the fact that eating plants directly can feed our population using far, far less water, land and other resources than meeting our nutritional needs through animal-based 'foods'. This is also true for South Africa and we must recognise this if we're going to survive and thrive in future water-shortage situations.
Dear Editor
As much as I respect, and greatly appreciate, the fascinating studies provided by water scientist Piotr Wiloski, the fact remains that he relies on only one rainfall station in the WCWSS to provide data from one of the worst drought periods in recorded South African history (1926 to 1936). Ideally we would have rainfall figures for more stations in the catchment area for that period, but these do not exist or are not reliable. He has not used the figures for Steenbras Dam, which are available from the City. Using those figures, with the other(s) available, might well result in a different interpretation of the 1926 to 1936 drought period, and how severe it was in relation to this recent period.
My point is, that it remains unwise to make claims about the worst drought in one hundred years / a thousand years, when the underlying data supporting that claim originates from just one rainfall station in a very large area. In the absence of representative data, would it not be more prudent to call it "one of the worst droughts in recorded history"?
Dear Editor
The media and commentators quote the city's figures that over 60% of Capetonians are allegedly not adhering to the 87l per person per day restriction (before it was reduced to 50l). This percentage has been constant since January 2017 despite residents drastically reducing consumption. I've been asking for a year - how do they determine if 4 million people are not keeping to 87l or whatever? It's impossible without a monthly population census of water consumption.
The city actually uses billing data, which provides overall monthly consumption from water meter readings, or estimated if meters weren't read, which often happens. From that they calculate average daily individual consumption. But they don't know how many people are in a household. So they've made assumptions - 10.5kl (the previous monthly limit) is based on four people in a household, which works out to 87l. But what if there are six or 10 or more people in a household? It throws out their calculations, based on global city averages, to give a false positive - the "over 60%" myth.
Their accusation of over 60% non-compliance is an estimate contradicted by their other truer estimate of “some 200 000 households are using more than 10,500 litres per month (more than 350 litres per day)” http://www.politicsweb.co.za/politics/level-6-water-restrictions-kick-in-on-1-january–c. There are 1.1 million households in Cape Town metro, so 200 000 is only 18% that are not complying. It’s probable among the 200,000 are multi- or extended family households that while keeping to personal daily limits are exceeding the household limit, i.e., reducing the rate of real, delinquent non-compliance.
Their “alt-facts” of 60% - as an average, it’s not absolute - alleged non-compliance is not surprising. They’re blaming sitting duck residents and politicising it, while for most of the year giving businesses, industry, etc, a pass from conservation, to deflect from their incompetence and tardiness dealing with the disaster. (See LA Times Friday 19th.)
Dear Editor
There is no point increasing water supply if the water system leaks it out. Currently, I understand that Capetown's system leaks about 15% of the water. At a daily consumption of 500 million liters that is around 75 million liters lost. Far more than all the bore holes produce.
What is necessary is to fix the leaks and bring leakage below 10%.
GroundUp Editor's Response
Leakage in Cape Town is about 15% according to municipal officials. This is much better than the world average of about 25%. Reducing it further is expensive. The City's engineers have to weigh up the cost-effectiveness of this versus other measures to increase supply and reduce demand of water.
© 2018 GroundUp. 
This article is licensed under a Creative Commons Attribution-NoDerivatives 4.0 International License.
You may republish this article, so long as you credit the authors and GroundUp, and do not change the text. Please include a link back to the original article.