How Cape Town more than halved its water usage
Water consumption has dropped dramatically, but there is still more to be done

Daily water consumption in Cape Town has more than halved over the past three years. It has decreased from 1.2 billion litres daily in February 2015 to 511 million litres daily (MLD) on 12 March 2018. Of this 689MLD drop over three years, 400MLD has come in a single year, between February 2017 and 2018.
This significant and impressive decrease owes itself largely to the City’s water demand management strategies and the collective will of Capetonians. However, it is still 61MLD above the City’s revised target of 450MLD, and there remain problems to consider.
In a recent article, GroundUp pointed out that reducing the amount of water Cape Town uses is even more important and affordable than increasing the water supply.
Professor Neil Armitage, a civil engineer at UCT, said that “reducing demand for water massively reduces the scale of augmentation required”.
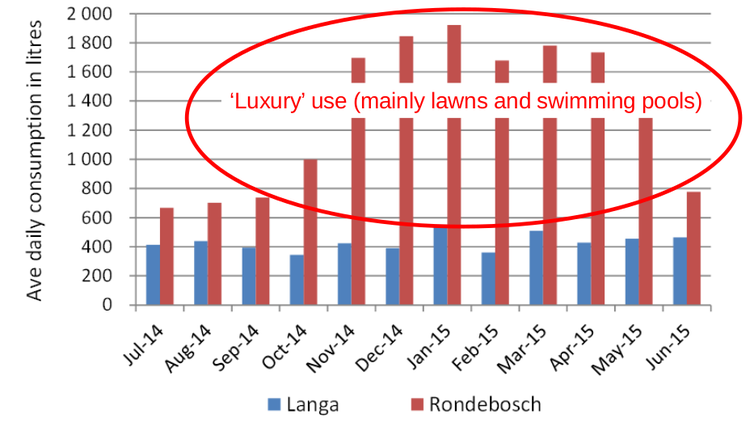
According to the Cape Town Water Outlook 2018 report, 70% of water usage in the city is residential. This is why water demand management strategies implemented by the municipality have focussed on households.
Water restrictions
Cape Town has had level 6B water restrictions since 1 February 2018. The goal of this is to get the city’s consumption down to 450MLD. These restrictions have come with penalties for those households using more that 6,000 litres per month.
The updated Water Outlook 2018 report says that tariffs have been introduced to make higher water usage more expensive. It goes on to state that “water is still cheap compared to other goods and services”.
The report also said that “level 5, 6 and 7 restriction tariffs have been approved by Council”.
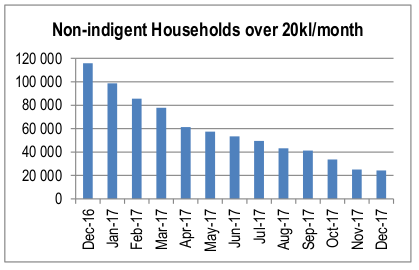
The City’s data suggests that these restrictions are working. Although wealthier households have been the highest users, the data shows that the number of these households using over 20,000 litres per month dropped from 100,000 in December 2016, to just over 20,000 households a year later.

Reduced water pressure
According to the municipality, pressure reduction was started more than a decade ago to reduce water demand and decrease the impact of leaks. The municipality has divided the city into pressure zones so that different pressures can be applied to different areas.
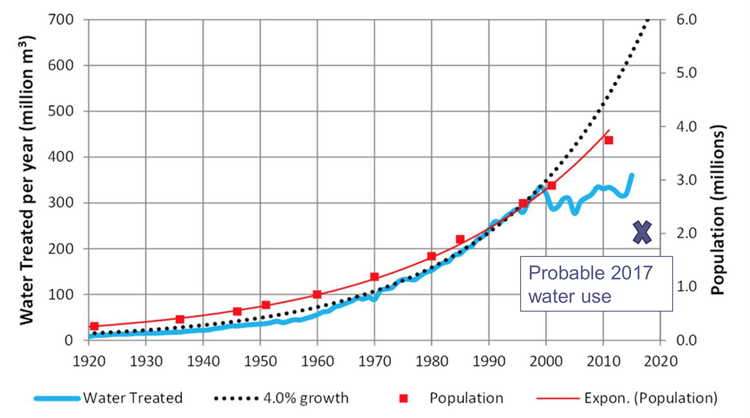
“Pressure reductions have made a huge difference,” said Armitage. “The drop-off of per capita water use between 1999 and 2015 was because of the work the City did. Since then the City has managed to drop water use even further – thereby staving off Day Zero.”

Cape Town has also done a good job of reducing its leaks. The world average for municipal water lost through leaks is about 25%. In Cape Town it is 15%, much better than most of the country. Presumably there is room to further improve this.
Installation of water management devices
Since 2007 the City has been installing water management devices to “manage debt” and restrict water consumption.
Xanthea Limberg said on Cape Talk Radio on 9 March 2018 that the City is installing 8,000 units per month and has installed a total of about 250,000 units to date.
According to the municipality’s 2016 community survey there are 1.26 million households in Cape Town. This means that one in five households have these devices installed.
However, according to the City’s data, 64% of these devices have been installed in indigent areas, even though wealthier areas have been shown to be much higher users of water.

Going forward, the City said that during level 6B water restrictions, the water management devices “will only be fitted above [10,500 litres per month] targeting highest users.”
A report by the Environmental Monitoring Group (EMG) looked at how water demand management relates to social inequality. The report emphasises “…the imperative for water demand management that is socially just and affordable”.
Taryn Pereira, one of the authors of the report and a senior researcher at EMG said: “Using water management devices to restrict households to their daily drought allocation of 50 litres per person per day, in cases where households have continued to have high consumption despite the severity of the drought, is something we support.”
“We do not support the installation of water management devices as part of a debt management campaign, which is how they have been used since 2007,” said Pereira.
Making more information available
The City has also made information on water consumption and storage levels freely available to the public. The water dashboard provides weekly updates of the water consumption and dam storage levels, while the water map enables users to see how much water specific addresses are using.
The City said it has made this information available to encourage “households to stay within usage limits”.
There has been great progress reducing water demand and decreasing consumption. But will it be sustained? Most Capetonians in formal houses have gone to great effort to reduce their consumption. Many have seen it even as a challenge to see how little water they can use. But it is possible that people may become tired of, for example, finding innovative ways to flush their toilets without municipal water. The good news is that there’s no sign yet of such fatigue. Water consumption has been consistently low through February and the first half of March.
Support independent journalism
Donate using Payfast

Don't miss out on the latest news
We respect your privacy, and promise we won't spam you.
© 2018 GroundUp. 
This article is licensed under a Creative Commons Attribution-NoDerivatives 4.0 International License.
You may republish this article, so long as you credit the authors and GroundUp, and do not change the text. Please include a link back to the original article.
