Here’s how unfairly police are distributed
Suburbs like Sea Point, Claremont and Camps Bay have far more officers per resident than Nyanga. Why?
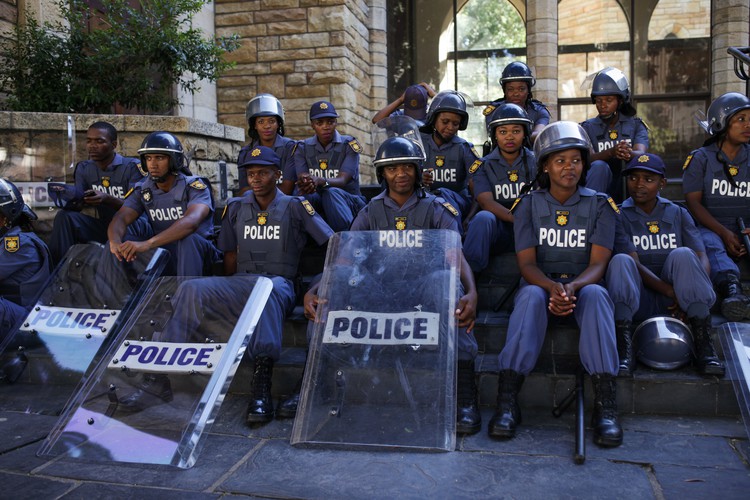
Human rights activists have taken the Minister of Police to the Equality Court because, they claim, police resources in the Western Cape and nationally are unfairly distributed. In fact, the Social Justice Coalition (SJC), Equal Education and the Nyanga Community Policing Forum say, the deployment of police officers discriminates against black and poor people.
Are police officers unequally distributed in the Western Cape? And what about the country as a whole?
There are two obvious ways to measure how police officers are deployed:
Population Equality, which would mean that there are roughly the same number of police officers per number of people served by each precinct.
Crime-rate Equality would mean that the number of police officers per precinct is roughly proportional to the number of crimes.
As it happens, the SJC has put together a useful spreadsheet based on data from SAPS that we have used to estimate both Population and Crime-rate Equality. (You can download the spreadsheet here.)
Let’s first look at Population Equality. The table below is a small selection of Western Cape precincts (there are a total of 150 precincts).
| Precinct | Population | Officers | Per 100k |
|---|---|---|---|
| Harare | 172,475 | 239 | 139 |
| Nyanga | 202,332 | 325 | 161 |
| Ocean View | 40,392 | 88 | 218 |
| Athlone | 63,307 | 185 | 292 |
| Kensington | 25,607 | 75 | 293 |
| Elsies River | 69,691 | 206 | 296 |
| Gordons Bay | 16,572 | 51 | 308 |
| Somerset West | 57,098 | 176 | 308 |
| Parow | 60,339 | 197 | 326 |
| Melkbosstrand | 12,383 | 41 | 331 |
| Strand | 51,600 | 172 | 333 |
| Fish Hoek | 20,287 | 77 | 380 |
| Simon’s Town | 13,043 | 50 | 383 |
| Pinelands | 20,663 | 80 | 387 |
| Sea Point | 24,808 | 161 | 649 |
| Camps Bay | 5,524 | 49 | 887 |
| Cape Town Central | 35,019 | 598 | 1708 |
We can immediately see from this table that there isn’t anything close to Population Equality. The number of police per 100,000 people ranges from 139 in Harare, Khayelitsha, to 1,708 in Cape Town Central. For readers with an interest in stats, the mean is 428 per 100,000, the median is 334 and the standard deviation is 261.
Interestingly, Nyanga, the precinct which sometimes has the highest murder rate in the country, has 161 police per 100,000 people. Camps Bay, with 49 cops for 5,500 residents, has a ratio of 887 police per 100,000 people, and it only had two murders from 2013 to 2016 (the four years covered in the SAPS spreadsheet).
What about Crime-rate Equality? The most meaningful measure of crime is the murder rate. Many crimes are under-reported, but it’s hard to miss a murder. The SAPS spreadsheet gives the number of murders per precinct for 2015 to 2016. Now take a look at the graph below. Each dot is a precinct. The y-axis gives the number of murders over four years in that precinct per 100,000 people, and the x-axis gives the number of police per 100,000 people.
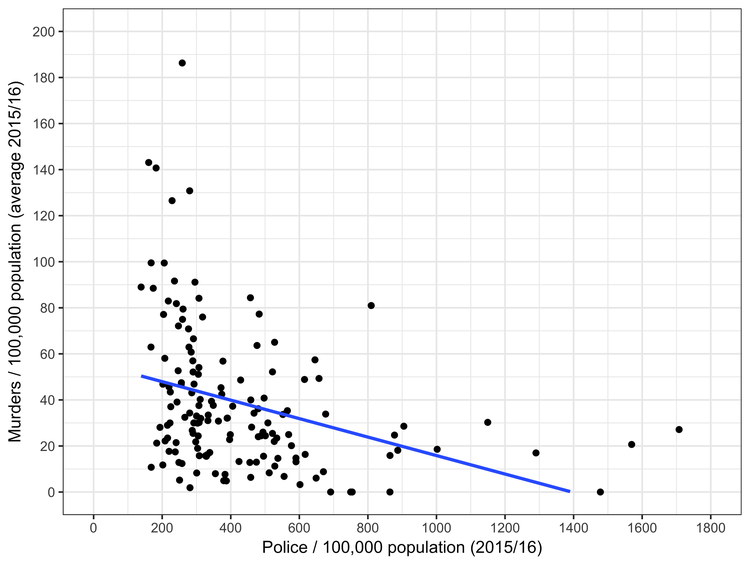
The blue line shows how these are correlated — in other words how the number of police changes as the number of murders increases. If there were a positive correlation — if the number of officers increased with the number of murders — the line would slope upwards from left to right. But the slope of the line shows exactly the opposite. It isn’t even flat (which would mean there’s no correlation). There is a correlation, a negative one — the number of officers decreases as the murder rate increases. Not only do we not have Crime-rate Equality, we have something approaching the exact opposite: evidence of a policy that actively favours inequality, a policy that places police officers where there are fewer murders. (For readers interested in stats the correlation coefficient is -0.34.)
There are some points to note about this analysis. Towns with small populations need a minimum contingent of officers for a police station to function. These precincts will necessarily have high ratios of police per 100,000 people. A second point is that the police in Cape Town city centre do not only serve the residents but the many thousands of people who commute to the city daily, as well as tourists. Nevertheless, these points do not come close to negating our findings.
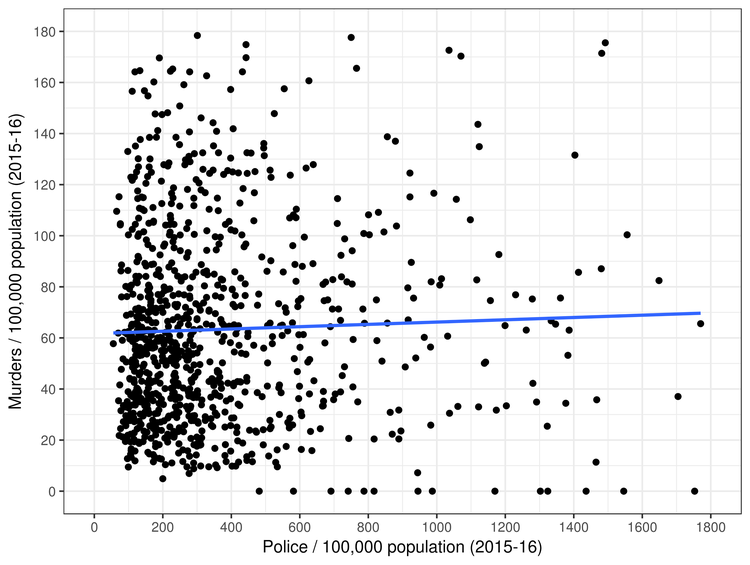
Is this massive inequality just a Western Cape phenomenon? What about the whole of South Africa? The graph below is for all precincts in all provinces except the Western Cape. Even here we see that there isn’t Population Equality. And the Crime-rate Equality blue line is flat, meaning that there isn’t Crime-rate Equality either. But the inequality of the latter is not as bad as the Western Cape where the curve actually goes in the wrong direction. (For readers interested in stats the correlation coefficient is 0.007.)
So the activist groups are right that police officers are very unequally and unfairly distributed in the Western Cape, and also in the rest of the country, though less so.
Are police officers distributed in a way that black and/or poor people get the worst of it? This we haven’t analysed in detail. But a cursory look at the data would suggest that in the Western Cape that does appear to be the case, though there are some exceptions.
The precincts in Cape Town with the fewest officers per 100,000 people include Harare, Nyanga, Lwandle, Delft, Kraaifontein, Gugulethu and Strandfontein. Philippi East had the highest murder rate in the period covered, and it too has relatively few police officers. These are predominantly black and poor areas. By contrast, the predominantly white and wealthy areas of Claremont, Sea Point, and Camps Bay are among the precincts with the highest number of officers proportionate to population.
Thanks to Eduard Grebe for doing the graphs using R. Here is the source code and the adjusted spreadsheet we used. Table Bay Harbour has been removed from the Western Cape data because it is an outlier, but, in any case, including it would strengthen the article’s findings.
Support independent journalism
Donate using Payfast
![]()
Don't miss out on the latest news
We respect your privacy, and promise we won't spam you.
Next: Ten years in prison not enough for cop who killed my daughter, says Durban mother
Previous: Thekwini College students protest against registration process
Letters
Dear Editor
The population equality ratio is not linear. There is a basic minimum number of police officers that is required to operate a Police Station. To have just one police officer on duty 24 hours a day, you need 93 shifts a month (3/day). That's 19 officers required just to have a Police Station open.
You could surely have obtained the minimum number from SAPS but it must be in excess of 25 without the capacity to do crime prevention. If the Police Station is to engage in crime prevention, then it needs at least 2 officers - 1 to man the station and 1 to patrol.
In other words, Camps Bay cannot possibly ever have the same officers/100k residents as Nyanga because that would result in 9 officers deployed to Camps Bay which is not enough to operate a Police Station. For the same reason, it is false to imply that Camps Bay can be effective at crime prevention with the same ratio of Police Officers. With hundreds of officers, Nyanga is able to deploy more officers on foot an vehicles who are more effective at crime prevention than a single desk-bound officer in Camps Bay.
In order to provide a basic minimum service, SAPS needs to deploy at least 50 officers to Camps Bay (2 officers per shift). The reality is worse than that. Camps Bay frequently has only one officer on duty and in recent times, there have been no available officers so that the Police Station has been closed.
Dear Editor
I am not sure where your researcher got their stats from but I can assure you from first hand knowledge that there is no chance in hell that Simonstown Police Station has 50 officers as claimed.
There have been occasions where only one member was on desk duty at night which prevented responses to call out requests. The station is only able to field one van for patrols covering an areas that extends from Glencairn all the way to Cape Point. If they are busy with a call and you are confronted in your home by an armed intruder you are left completely to your own devices.
Whilst I am pretty sure that deployment patterns do disadvantage poorer areas the article falls short as it fails to explore the overall depletion of member numbers in the W Cape. It is suggested that the overwhelming number of vacant & unfilled positions in SAPS nationally are in the W Cape and that this may indeed be deliberate as a political ploy to punish voters for abandoning the ANC at the ballot box.
Please investigate this.
© 2018 GroundUp. 
This article is licensed under a Creative Commons Attribution-NoDerivatives 4.0 International License.
You may republish this article, so long as you credit the authors and GroundUp, and do not change the text. Please include a link back to the original article.